bug #5048
closedcdm-server causes unusual high native memory consumption for jvm
100%
Description
Our cdm-server are suffering from memory problems! Evidence for this can bee seen st least since the middle of last week.
- edit-int was consuming about 12GB of RAM with only 4 instances running. This became obvious because the server was swapping and became more or less unresponsive. After a restart RAM consumption was at 5GB,
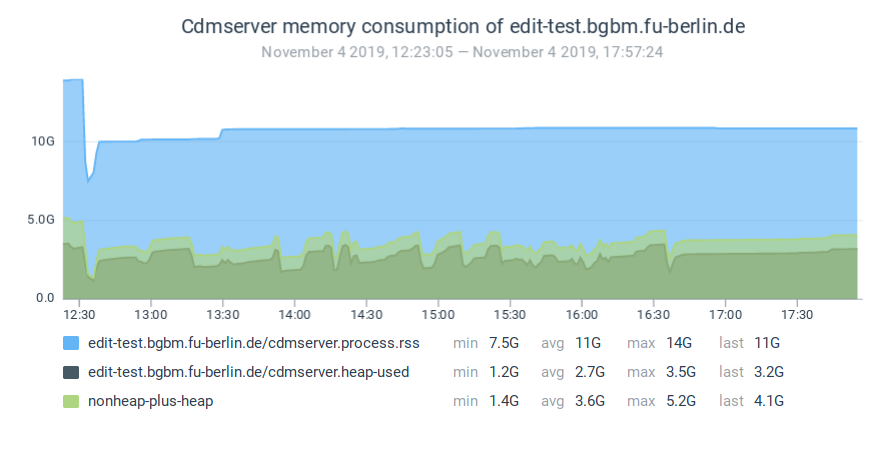
- edit-test was today also consuming about 12GB of RAM but with over 20 instances. It also was stalled due to swapping memory to the disk.
- edit-production spit out a lot of monit warnings that the server reached the warning limit of more that 80% RAM being consumed.
see also #5375
General background information
The top rated post to stackoverflow - Java using much more memory than heap size provides an excellent explanation of the whole jvm memory consumption. The factors that sum up to the total memory footprint of a java application are:
Total memory = Heap + Code Cache + Metaspace + Symbol tables +
               Other JVM structures + Thread stacks +
               Direct buffers + Mapped files +
               Native Libraries + Malloc overhead + ...
- https://dzone.com/articles/how-much-memory-does-a-java-thread-take
- Tuning Garbage Collection with the 5.0 Java TM Virtual Machine
- https://stackoverflow.com/questions/561245/virtual-memory-usage-from-java-under-linux-too-much-memory-used
native memory fragmentation
- Why does my Java process consume more memory than Xmx? : good explanation of the phenomenon and malloc tuning tips, links to the very good IBM article:
- Linux: Native Memory Fragmentation and Process Size Growth - Kevin Grigorenko - IBM WebSphere SWAT Blog ... native heap fragmentation in Java program is much less likely than native memory program demands or a leak, so I always investigate those first (using techniques described elsewhere):
- WSTE_KevinGrigorenko_LinuxNative Presentation slides (preserved here and attached to the ticket: WSTE_KevinGrigorenko_LinuxNative.pdf)
Native memory tracking
- https://docs.oracle.com/javase/8/docs/technotes/guides/vm/nmt-8.html#how_to_use
- https://docs.oracle.com/javase/8/docs/technotes/guides/troubleshoot/tooldescr007.html (*****)
- https://stackoverflow.com/questions/2756798/java-native-memory-usage
- https://www.techpaste.com/2012/07/steps-debugdiagnose-memory-memory-leaks-jvm/ (****)
- https://plumbr.io/blog/memory-leaks/native-memory-leak-example
jemalloc
- jemalloc home
https://technology.blog.gov.uk/2015/12/11/using-jemalloc-to-get-to-the-bottom-of-a-memory-leak/
https://docs.tibco.com/pub/bwce/2.4.5/doc/html/GUID-231E1EFC-EA7C-4072-B0F4-0D92093D3161.html
https://jenshadlich.blogspot.com/2016/08/find-native-memory-leaks-in-java.html
installation and usage
download jemalloc-5.2.1.tar.bz2 from https://github.com/jemalloc/jemalloc/releases and extract the archive. In the extracted folder ($JMALLOC_FOLDER):
./configure --enable-prof
make
the executable and the library file are now found here:
- $JMALLOC_FOLDER/bin/jeprof
- $JMALLOC_FOLDER/lib/libjemalloc.so
to profile the cdmlib-remote-webapp instanc or cdmserver, add the following env variables to the eclipse jetty launcher:
LD_PRELOAD=$JMALLOC_FOLDER/lib/libjemalloc.so
MALLOC_CONF=prof:true,lg_prof_interval:24,lg_prof_sample:17
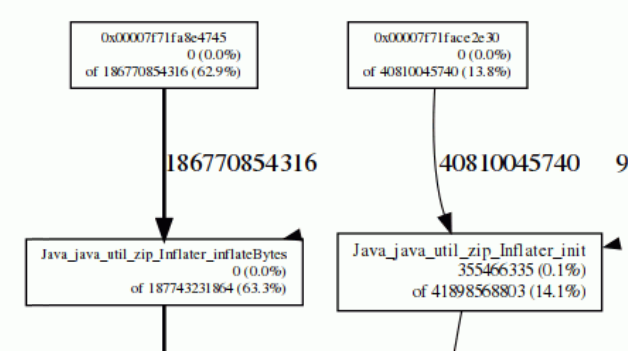
Compared to the above linked posts I am using the quite low lg_prof_interval of 224 (~16MB) to record the allocation fine grained. With this setting I could bin the massive allocations down to the cause Java_java_util_zip_Inflater_init (see below in results)

now start the launcher to run the application. jemalloc will write several files named like jeprof.*.heap in the working directory
the jeprof executable can create diagrams from these files:
bin/jeprof --show_bytes --gif /opt/java-oracle/jdk1.8/bin/java jeprof.*.heap > app-profiling.gif
see picture743-1.png
more details on the result and conclusions below in the chapter Diagnoses and results
perf
(was not valuable to pin down the root cause)
installation
apt install linux-tools-$(uname -r) linux-tools-generic
running
sudo sh -c "echo -1 > /proc/sys/kernel/perf_event_paranoid"
sudo sh -c "echo 0 > /proc/sys/kernel/kptr_restrict"
perf record -g mvn jetty:run-forked
analyze
perf report
and search for stack traces containing "Inflator"
Similar issues
MALLOC_ARENA Issue
- http://stackoverflow.com/questions/561245/virtual-memory-usage-from-java-under-linux-too-much-memory-used#28935176
- http://serverfault.com/questions/341579/what-consumes-memory-in-java-process#answer-554697
- http://stackoverflow.com/questions/18734389/huge-memory-allocated-outside-of-java-heap
- http://stackoverflow.com/questions/26041117/growing-resident-memory-usage-rss-of-java-process
- https://www.ibm.com/developerworks/community/blogs/kevgrig/entry/linux_glibc_2_10_rhel_6_malloc_may_show_excessive_virtual_memory_usage?lang=en
The MALLOC_ARENA Issue is a known problem with glibc >= 2.10 your servers running jessie have glibc 2.19 installed!
Setting MALLOC_ARENA_MAX env variable to a low value (0-4) could help
export MALLOC_ARENA_MAX=4
but only lead to a decrease in performance but did not reduce memory consumption at all
Diagnoses and results
Diagnosis of edit-test as of 30.06.2015
settings for the cdmserver:
-Xmx4500M -XX:PermSize=512m -XX:MaxPermSize=1800m
system memory usage of the cdm-server process:
KiB Mem:  10266200 total,  9720060 used,   546140 free,    95836 buffers
KiB Swap:  2097148 total,  1870592 used,   226556 free.  1442588 cached Mem

  PID USER      PR  NI    VIRT    RES    SHR S  %CPU %MEM     TIME+ COMMAND
31761 cdm       20   0 18.997g 6.710g   3084 S   0.0 68.5  42:35.69 jsvc
Almost all of the Swap space is being used.
$ jmap -heap 31761

Attaching to process ID 31761, please wait...
Debugger attached successfully.
Server compiler detected.
JVM version is 24.71-b01

using thread-local object allocation.
Garbage-First (G1) GC with 4 thread(s)

Heap Configuration:
   MinHeapFreeRatio = 40
   MaxHeapFreeRatio = 70
   MaxHeapSize      = 4718592000 (4500.0MB)
   NewSize          = 1363144 (1.2999954223632812MB)
   MaxNewSize       = 17592186044415 MB
   OldSize          = 5452592 (5.1999969482421875MB)
   NewRatio         = 2
   SurvivorRatio    = 8
   PermSize         = 536870912 (512.0MB)
   MaxPermSize      = 1887436800 (1800.0MB)
   G1HeapRegionSize = 1048576 (1.0MB)

Heap Usage:
G1 Heap:
   regions  = 4380
   capacity = 4592762880 (4380.0MB)
   used     = 3908545928 (3727.479866027832MB)
   free     = 684216952 (652.520133972168MB)
   85.10228004629754% used
G1 Young Generation:
Eden Space:
   regions  = 602
   capacity = 874512384 (834.0MB)
   used     = 631242752 (602.0MB)
   free     = 243269632 (232.0MB)
   72.18225419664269% used
Survivor Space:
   regions  = 10
   capacity = 10485760 (10.0MB)
   used     = 10485760 (10.0MB)
   free     = 0 (0.0MB)
   100.0% used
G1 Old Generation:
   regions  = 3116
   capacity = 3707764736 (3536.0MB)
   used     = 3266817416 (3115.479866027832MB)
   free     = 440947320 (420.52013397216797MB)
   88.10746227454275% used
Perm Generation:
   capacity = 1504706560 (1435.0MB)
   used     = 1504138704 (1434.4584503173828MB)
   free     = 567856 (0.5415496826171875MB)
   99.96226134615908% used

59361 interned Strings occupying 5910712 bytes.
so this is in total ~10GB of heap capacity for this process whereas G1 Old Generation and Perm Generation are together using ~5GB alone!!!
Diagnosing with jemalloc
Result:
bin/jeprof --show_bytes /opt/java-oracle/jdk1.8/bin/java jeprof.*.heap

(jeprof) top
Total: 43983701067 B
40533531248  92.2%  92.2% 40533531248  92.2% je_prof_backtrace
3221225472   7.3%  99.5% 3221225472   7.3% init
138076277   0.3%  99.8% 138076277   0.3% readCEN
88637123   0.2% 100.0% 6607433823  15.0% Java_java_util_zip_Inflater_init
 2230945   0.0% 100.0%  2230945   0.0% allocate_dtv
       0   0.0% 100.0%  5177469   0.0% 0x00007f8b667661b8
       0   0.0% 100.0% 481181154   1.1% 0x00007f8b66778a33
       0   0.0% 100.0%  8653482   0.0% 0x00007f8b6677a43a
       0   0.0% 100.0%  8653482   0.0% 0x00007f8b6677a448
       0   0.0% 100.0% 10687701   0.0% 0x00007f8b66783835
This analysis clearly shows that the problem is related top Java_java_util_zip_Inflater_init which uses zlib.
Searching the web with this information reveals a bug in a range of oracle jdk versions:
- https://github.com/eclipse/jetty.project/issues/575
- https://bugs.java.com/bugdatabase/view_bug.do?bug_id=8156014
- https://bugs.openjdk.java.net/browse/JDK-8156014
The bug was reported for jdk8u40 (was not reproducible in jdku60) but persists in jdk8u131 and for sure in the latest jdk8 since oracle decided for not fixing this in jdk8 versions. In jdk9 ServiceLoader has exchanged by a new implementation which doesn't have this bug.
Switching to jdk9 as JRE is not a quick option, in the jetty bug report 575 a workaround is suggested which uses a custom cache configuration to disable url caching which effectively disables the buggy ServiceLoader:
Try creating an xml file (eg called "caches.xml") with the following contents:
<Configure id="Server" class="org.eclipse.jetty.server.Server">

 <Set class="org.eclipse.jetty.util.resource.Resource" name="defaultUseCaches">false</Set>
 <New class="java.io.File">
   <Arg>
    <SystemProperty name="java.io.tmpdir"/>
   </Arg>
   <Call name="toURI">
     <Call id="url" name="toURL">
       <Call name="openConnection">
         <Set name="defaultUseCaches">false</Set>
       </Call>
     </Call>
   </Call>
 </New>
</Configure>
Then put that on the command line eg java -jar ../start.jar caches.xml
Applying this locally effectively reduced RRS from 1297,05078125 to 495,04296875 (compared with the measurement from comment 17) and thus freed 802,0078125 MB
pmap
analysis of cdmserver running 10 cdm instances with -Xmx3000M -XX:+UseG1GC with pmap:
sudo pmap -p 18803 -x > pmap-10-instances-q.txt
# summing up by category uing awk, categories are listed below in the table,
# here at the example of .jar
egrep "\.jar" pmap-10-instances-q.txt | awk  'BEGIN{sum=0}{gsub("K","",$2); sum+=$2;}END{print sum;}'
| KB | MB | |
|---|---|---|
| total as reported by pmap | 12058940 | 11776,3085937 |
| anon | 11979648 | 11698,875 |
| *.so | 59888 | 58,484375 |
| *.jar | 15336 | 14,9765625 |
| stack | 136 | 0,1328125 |
| java | 8 | 0,0078125 |
| *.cfs | 148 | 0,14453125 |
| *.js *.css *.ico | 180 | 0,17578125 |
| ./locale/locale-archive | 3564 | 3,48046875 |
| /tmp/hsperfdata_usr/18803 | 32 | 0,03125 |
| sum | 11776,30 |
Conclusion
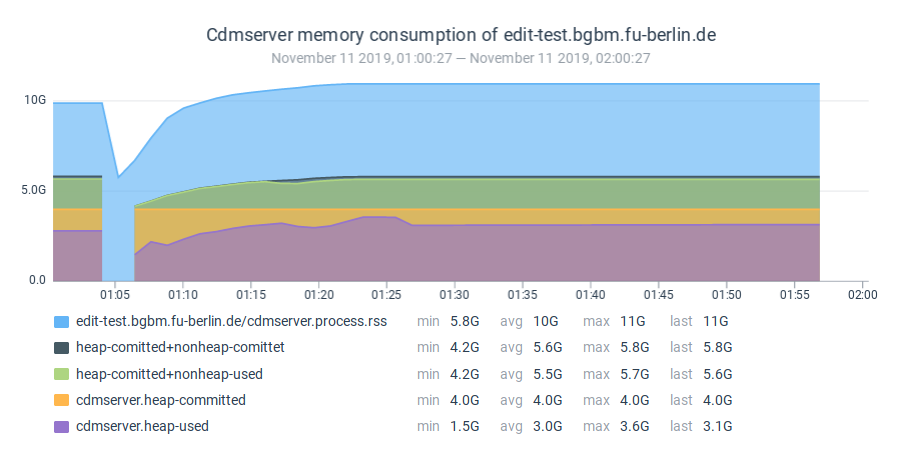
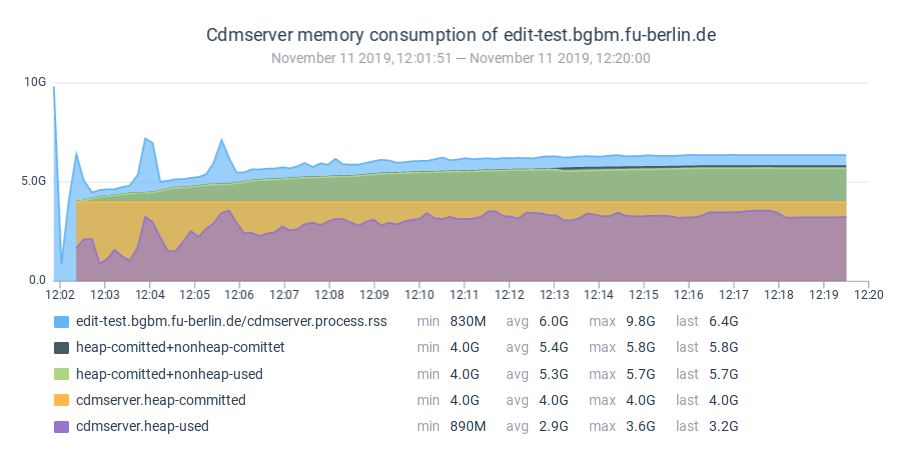
- The actual native memory consumption as a significant variance. For the test server running 18 cdm-webapp instances the RSS measure has a variance of ~1GB.
- The java8 memory leak was causing some of the RSS overhead but there is still a significant amount of native memory for which clear evidence could not be found, so the cause for this overhead is still unclear. The
jdk8MemleakFixsaved about 2GB of memory in the test server running 18 instances. - As far as the current state of the analysis shows, it is very likely that the huge RSS overhead is caused by memory fragmentation. Using
jemallocinsted ofmalloccan help to limit the native memory consumption a bit. --> SUCCESS - Tuning memory allocation by setting
MALLOC_*environment variable may help, but the settings as posted in stackoverflow - Java using much more memory than heap size (linked above) did not decrease the RSS level. More analysis is needed to find the appropriate parameter values.
Files
Related issues